Welcome to Day 2 of your Apex learning journey! Today, we will guide you through setting up your Salesforce Developer Org, introduce the Salesforce Setup and Developer Console, and explore basic navigation and key features of the Developer Console. We will also explain how to create Apex classes and triggers, view logs, and run tests.
1. Creating a Salesforce Developer Org for Practice
As we discussed in a previous blog, Apex runs only on the Salesforce Server for which salesforce introduced the Developer Org that can be accessible for anyone without any fee. But there will be some limitations and for practice purposes these Developer Orgs are more than Enough.
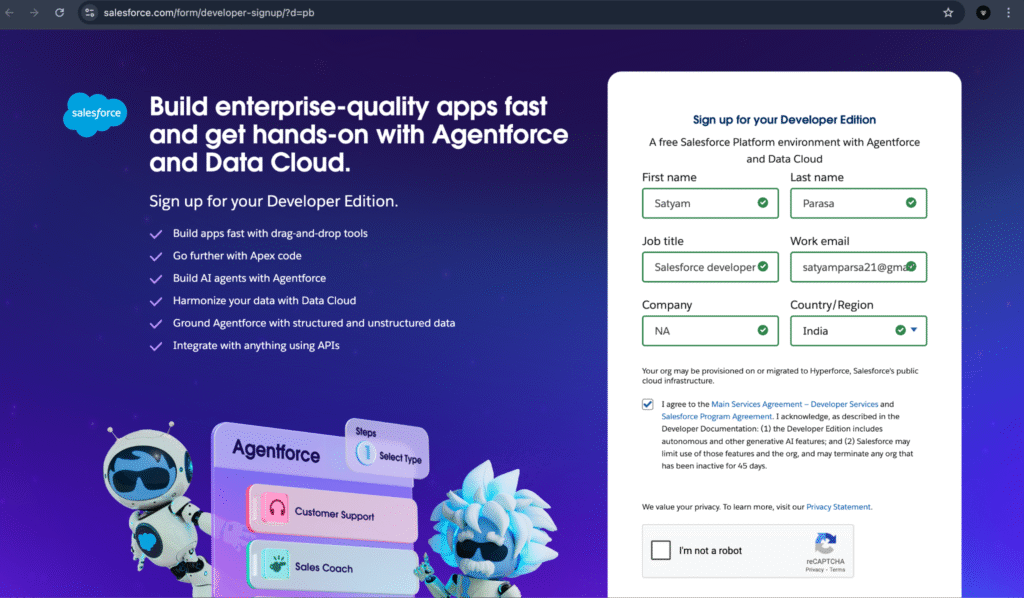
Steps to Create a Developer Org:
- Visit Salesforce Developer Edition Sign-Up.
- Enter your name, email, company details, and country.
- After submitting, you’ll receive a confirmation email. Follow the instructions in the email to log into your Developer Org.
- Once logged in, you’re all set to begin exploring Salesforce and writing Apex code!
2. Introduction to Salesforce Setup and Developer Console
Once your registration for the developer org is complete, you can access Salesforce by going to login.salesforce.com for production(Dev org is also a PROD) and entering your username and password. The UI will look like the screenshot below.
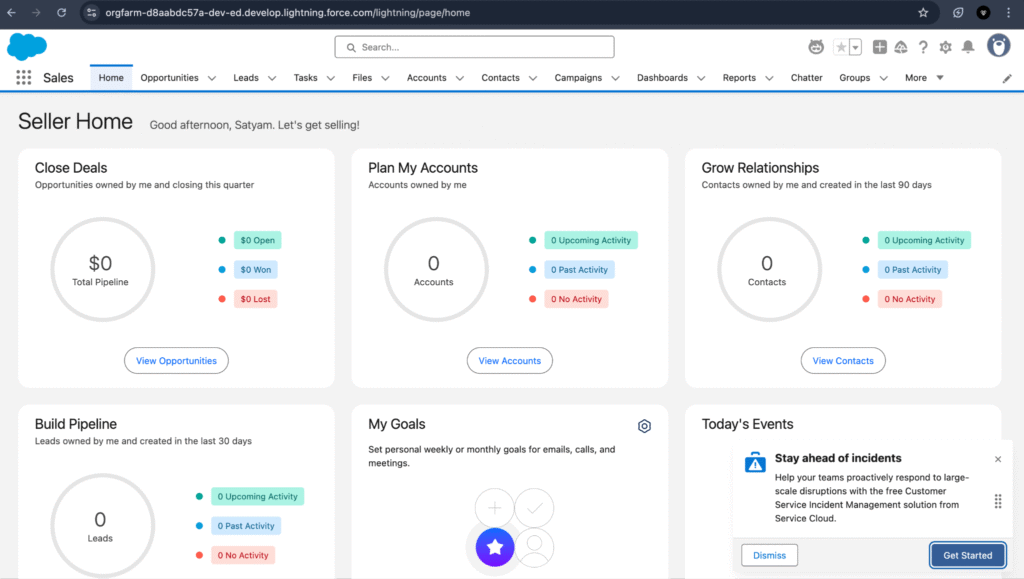
Salesforce Setup
In Salesforce Setup we can configure, customize, and manage our Salesforce environment. Just go to the top-right corner of your screen by clicking on the gear icon and selecting Setup.

In Salesforce Setup, you can:
- Create and manage custom objects and fields.
- Configure automation tools like Workflow Rules and Process Builder.
- Manage users and permissions.
Write and deploy Apex classes and triggers.
What is the Developer Console?
The Developer Console is a built-in tool within Salesforce used to write, debug, and execute Apex code and SOQL queries.
To access the Developer Console:
- Click on the gear icon in the top-right corner.
- Select Developer Console from the dropdown menu.

3. Basic Navigation and Tabs in the Developer Console
Once you open the Developer Console, you will see several tabs, each with its own functionality: Let’s talk about some commonly used tabs.
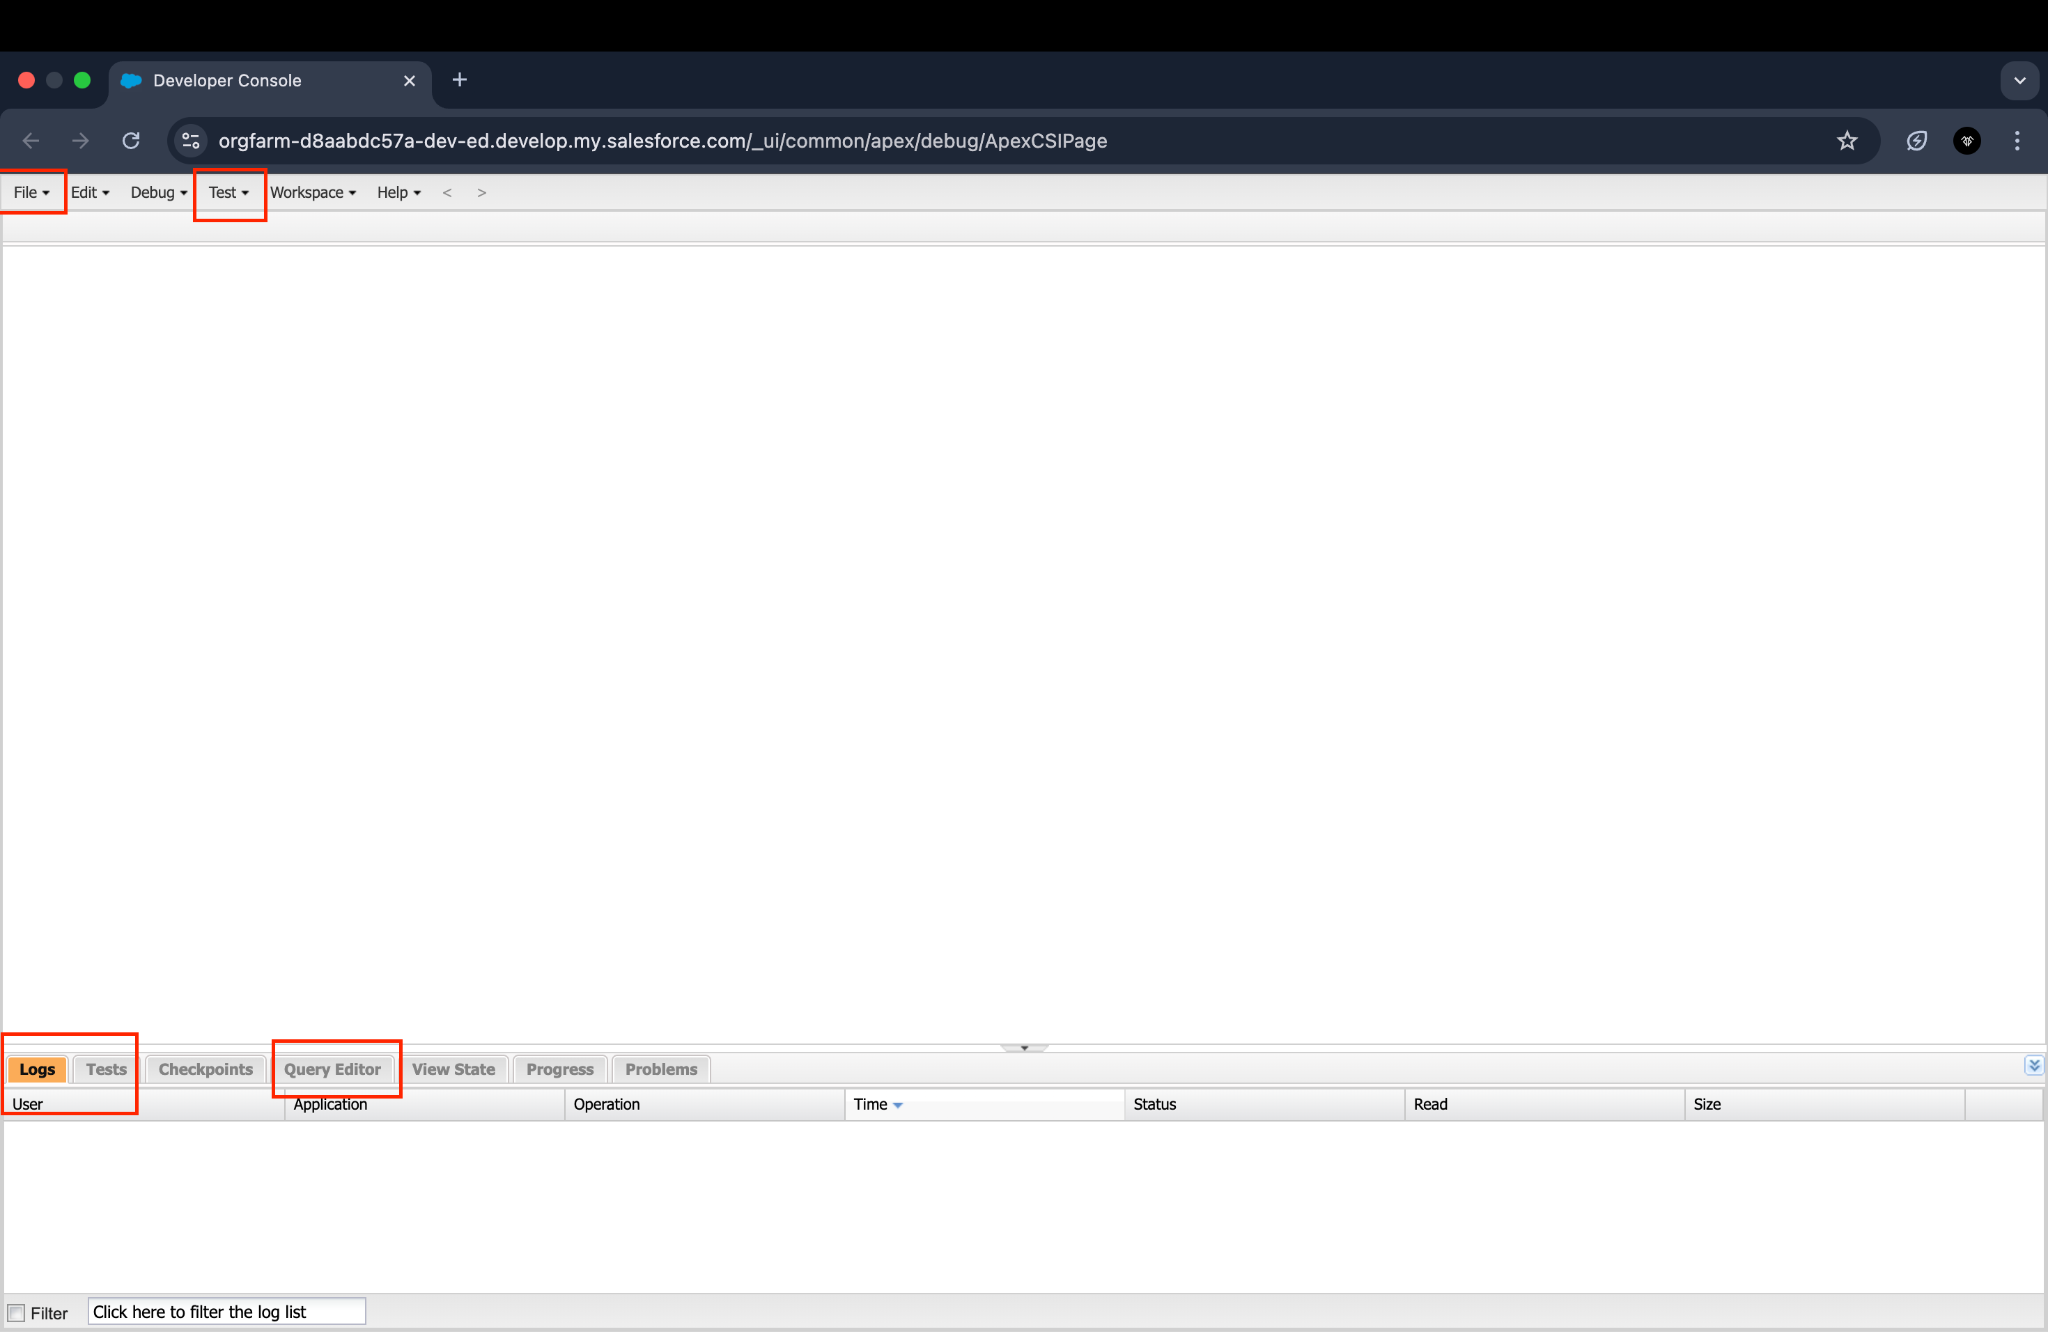
File: Here, you can create new files (Apex classes, triggers), open existing ones, and manage your code.
Logs: Displays logs of Apex code execution, queries, and other activities. Logs are essential for debugging.
Tests: Allows you to view the test results.
Test: In this Tab we can find all testion operations.
Query Editor: A tool to run SOQL (Salesforce Object Query Language) queries to retrieve data from Salesforce.
Also Read
Don’t forget to checkout: What Is Salesforce Apex? A Beginner’s Guide.
4. How to Create Apex Classes and Triggers
In the Developer Console, you can create and manage both Apex classes, Apex triggers.
Creating an Apex Class:
- Go to the File menu and select New > Apex Class.
- Give your class a name (e.g. MyFirstClass ) and start writing your code.
Note: You will automatically get the class template.
Creating an Apex Trigger:
- Go to File > New > Apex Trigger.
- Choose the object to which the trigger will apply (e.g., Account).
- Write your trigger logic.
Example of a simple trigger that updates a custom field when an Account is created:

On Day 7 and 8 we will learn more about Apex classes and triggers.
5. Viewing Logs and Debugging
How to View Logs:
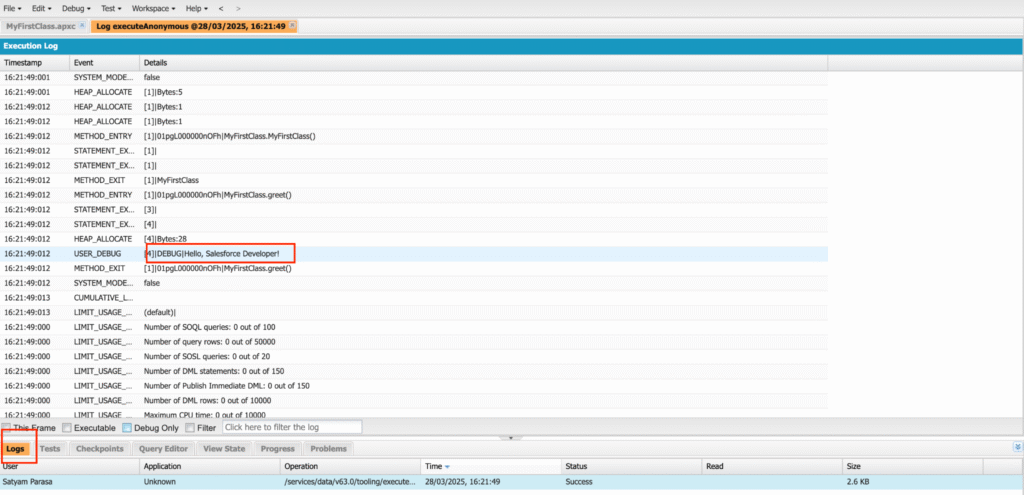
- After executing some code (e.g., running a trigger or class), go to the Logs tab in the Developer Console.
- Click on any log to open it and see detailed information, including errors, system debug statements (System.debug()), and execution steps.
6. Searching for Methods, Classes, and Other Files
To quickly find methods or classes in the Developer Console, use the Search in files feature.
How to Search:
- Click on the Edit tab
- Type the name of the class, method, or keyword you’re looking for.
- The results will display in the Search Results panel, allowing you to quickly jump to the desired code by double clicking on it.

7. Using the Anonymous Window
The Anonymous Window allows you to execute Apex code immediately without saving it to a file. It’s useful for running quick tests or one-off scripts.
How to Use the Anonymous Window:
- Open the Anonymous Window by going to Debug > Open Execute Anonymous Window.
- Write the Apex code you want to execute. You can execute the whole code once or Highlighted code.

8. Running Test Classes and Monitoring Tests
The Test tab in the Developer Console allows you to run unit tests for your classes and triggers.
How to Run a Test Class:
- Go to the Test tab in the Developer Console.
- Click on New Run. or you will find the Run test button on a specific test class.
- Select the test classes you want to run (you can run multiple tests at once).
- Click Run to execute the tests.
On Day 10, we will dive deeper into Apex debugging and test classes.
Conclusion
On Day 2, you’ve learned how to set up your Salesforce Developer Org and get comfortable with the Salesforce Developer Console. You’ve also learned how to create Apex classes and triggers, view logs, use the Anonymous Window for quick testing, and run Apex tests.
Keep practicing these steps as you move forward in your Salesforce development journey. On Day 3, we’ll discuss more about Apex code! Stay tuned. Happy coding


